

Make-it Capital Edition #41
| The World of Cryptocurrencies |
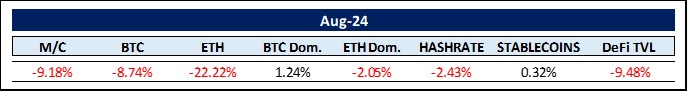
August was one of the weakest months in crypto history. This has a lot of reasons, the most pertinent probably being the end of the yen carry trade. In addition, there was increased regulatory scrutiny, particularly from the US Securities and Exchange Commission (SEC), which led to uncertainty among investors. Macroeconomic factors such as general economic concerns, which were reflected in the weak employment data in the US also did not contribute to risk appetite. We are also in the usual summer doldrums. All in all, this slump is likely to be temporary.
So let’s dive into more detail: According to crypto market research firm CryptoQuant, Bitcoin miners have been selling their mined Bitcoin in droves. It is undeniable that it has become much more difficult for miners to do business. With the fixed Bitcoin block reward dropping 50% to 3.125 BTC on April 19 and network fees remaining relatively low, the industry has faced a seismic loss of income that it is still adjusting to. Since the halving, Bitcoin’s overall hash rate has basically remained unchanged (rising 2%), meaning that mining a Bitcoin block remains as difficult and costly despite the lower reward. Still, many mining stocks have performed well since the halving, with the Valkyrie Bitcoin Miner ETF (WGMI) up 22% since April 19. This rise is certainly fueled at least in part by M&A rumors in the industry, as we alluded to in Edition #40.
Bitcoin ETFs have seen outflows in the order of $480 million over the last four days of August. Currently, a total of 917,956 BTC are held in all BTC ETFs.
Bitcoin whales are seen as potential sellers unsettling the crypto market. Kaiko, a leading source of cryptocurrency market data and research, estimates that the US government holds about 203,220 bitcoin, followed by China with 190,000, the UK with 61,200 and Ukraine with 46,350. Governments are seizing tokens in criminal cases, while Ukraine is believed to have received donations to fund its defense against the Russian invasion. Meanwhile, Mt. Gox has about 46,170 tokens left to distribute. “The supply overhang has been a theme in the crypto markets all summer,” said Kaiko analysts Adam Morgan McCarthy and Dessislava Aubert. There are several “prominent holders that could be potential sources of selling pressure in the coming months.” Sovereign states, however, are unlikely to rush to sell their stakes (apart from Germany that sold 49,858 BTC between June 19 and July 12), but Mt.Gox’s creditors are an unknown factor. So far, they seem willing to wait. That is one of the advantages of a low base that is not leveraged. They are not as sensitive to minor moves, but are likely to make their decisions after weighing up capital gains tax and the need to raise cash.
Previously, the consensus was that a rising BTC price would lead to a trickle-down effect for ETH and eventually spill over to the long tail of “altcoins” — an affectionate term commonly used to describe all other crypto assets outside of the two big “majors”. We saw this dynamic play out in the last cycles. As BTC and ETH rose, so did everything else. Right now, the majors feel more disconnected than ever from the rest of the market, especially BTC. Despite the 128% rise over the last 12 months, we haven’t seen the “Everything Rally” that many expected. We have seen small pockets of outperformance — Solana, AI, memecoins — but the majority of the crypto market has largely underperformed. ETH, for example, is up “only” 53% year-on-year. Dispersion has been the story of the tape this cycle — and it could very well continue. Coindesk condensed performances since 2017:
* By comparison, during the 2017 cycle, the total market capitalization of cryptocurrencies grew from around $40 billion to nearly $740 billion (18x). The market capitalization of “altcoins” grew from virtually zero to over $400 billion — with 90% of this growth occurring in the second half of 2017 alone.
* In the 2020-2021 cycle, the overall market grew from a base of $280 billion to nearly $2.8 trillion (10x), while the market capitalization of “altcoins” grew from $70 billion to $1 trillion (15x).
* However, in this cycle, the entire crypto market has barely grown by 2x — and the market capitalization of “altcoins” has grown even less. Even at the market peak in March 2024, the total market capitalization of altcoins was still $200 billion below the previous peak in November 2021.
Are we witnessing a fundamental shift or is this just temporary and an excellent entry point? Our crystal ball refuses to give us a useful answer. For this reason, we remain cautious until a clear picture emerges.
Different topic: Energy needs of the crypto world. With energy demand on the rise, fueled primarily by AI data centers and the drive to electrify all sectors, a potential energy shortage could be just around the corner. Time to review the crypto industry’s energy consumption. The Cambridge Bitcoin Electricity Consumption Index (CBECI) estimates that Bitcoin’s energy consumption came in around 121.1 terawatt hours (TWh) in 2023. By comparison, The Netherlands consumed around 121.6 TWh in 2023. The higher the hash rates and the larger the blockchain, the more sophisticated machines (which consume more electricity) will be needed to mine new bitcoins. The CBECI estimates that Bitcoin will consume around 147 TWh this year. That’s an increase of 21%. That is of course an enormous amount of energy. However, the more energy it takes to confirm a block, i.e. the higher the hash rate, the more secure the network becomes. As Bitcoin becomes more and more important in the international financial system, it needs to be as secure as possible. The good news is that 54.5% of the Bitcoin network is powered by renewable energy sources, and that number continues to rise.
Moving on to the rather underperforming Ethereum network. Global asset manager VanEck has published a new report predicting that the price of Ethereum will rise to $22,000 by 2030, calling the cryptocurrency “a revolutionary asset with few parallels in the non-crypto financial world”. VanEck estimates that the network’s total addressable market is $15 trillion. VanEck calls Ethereum the heart of its own financial system, as its network already secures more than $90 billion in stablecoins, about $7 billion in tokenized assets and $308 billion in digital assets. While Ethereum generated $3.4 billion in revenue last year, VanEck expects this figure to reach $51 billion by 2030. The report highlighted some of the unique aspects of Ethereum as a network and asset, from its nature as “programmable money” to a “yield-bearing commodity.” In particular, the VanEck report calls Ethereum an “internet reserve currency” that is central to its massive ecosystem and Layer 2 networks. I am sure Vitalik Buterin does not mind reading such reports. Should you like to delve deeper into the ETH world, here is a link to a another detailed report this time by Galaxy: The Ethereum Government:
https://www.galaxy.com/insights/research/ethereum-governance…
Finally, let us return to the inevitability of asset tokenization. Here is Larry Fink of BlackRock: “Bitcoin ETFs are just the first step in the technological revolution of finance.” The second step is tokenization whereby every single asset is digitized and stored on a blockchain.
In edition #40, we drew attention to BlackRock’s new asset tokenization fund BUIDL, which had already attracted $300 million in assets in its first month. This month, we want to dive deeper.
The inevitability of asset tokenization stems from a transformative change in financial markets. While crypto-native tokens (such as Bitcoin and Ethereum) are purely digital and serve multiple purposes within their ecosystem, tokenized real-world assets (RWAs) bridge the gap between digital and traditional finance. They bring liquidity and fractionalization to assets that were previously less accessible. Examples of tokenized RWAs include treasuries, commodities, real estate, private equity, art, intangible assets and countless more.
Currently, on-chain RWAs represent a $7.5 billion market – mainly in the form of tokenized government bonds (BENJI and USDY). However, a 2022 report by the Boston Consulting Group estimates that the market for tokenized assets could reach $16 trillion by 2030.
Here are some benefits that we believe will lead to meteoric adoption:
1.) Tokenization increases overall liquidity by making otherwise non-tradable assets tradable;
2.) Fractional ownership allows investors to get into previously inaccessible, high-value assets;
3.) Tokenization opens up markets 24/7 and bypasses unnecessary and costly middlemen;
4.) Tokenization enables DeFi protocols for loans, liquidity pools, futures, and derivatives.
In summary, asset tokenization is not just a trend, but represents a fundamental shift towards a new era of asset management. As trillions of dollars flow into blockchain networks, the integration of wallet infrastructure and the replacement of intermediaries are becoming standard practice.
Closing, here is Benjamin Disraeli and what he thinks about intermediaries and middlemen (whom we won’t need anymore …): “It is well known what a middleman is: he is a man who bamboozles one party and plunders the other.”
The World of Commodities
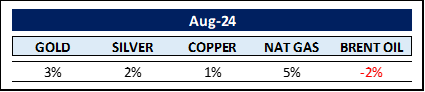
Natural Gas has seen a bit of a positive price reversal (year-on-year prices are still down 22.5% though). Let’s look into this. Record production of 104 billion cubic feet per day (bcf/d), stagnant consumption and the mildest winter in the last seven years have all contributed to lower natural gas prices. In 2023, the average price of natural gas in the US was $2.57 per million British thermal units (MMBtu). According to data provider Refinitiv Eikon, this is around 62% less than in 2022. The US Department of Energy (DOE) expects an average natural gas price of $2.20 per MMBtu this year. However, due to exploding demand from AI data centers, the DOE expects 20 new natural gas-fired power plants with a total capacity of 7.7 gigawatts to come online in 2024 and 2025. As oversupply runs out and demand increases, the DOE expects natural gas prices to rise to an average of $3.10 per MMBtu in 2025.Then there is the rising demand for Liquified Natural Gas (LNG) supporting the upwards price trend. For instance, China intends to increase the share of natural gas in its energy supply mix from 8.5% to 15% in 2030. India wants to increase its share from 6 % to 15 % in the same period. S&P Global Commodity Insights assumes that demand for LNG will increase by around 75% from today to almost 25 billion cubic meters per day in 2028. It seems that we will have to prepare for higher gas prices from 2025 onwards.
Let’s move to another element crucial to the global energy supply: Uranium. The demand for uranium from China, India, Japan, the USA and Europe is increasing much faster than the miners can extract it from the ground. The president of TradeTech, Treva Klingbiel, estimates that demand could exceed supply by more than 100 million pounds per year by the 2030s. “There is no substitution when you own a nuclear reactor,” says Mike Alkin, chief investment officer at Sachem Cove Partners. Russia’s isolation is only exacerbating the supply shortages. Not only are European countries desperately seeking alternative fuels to replace the Russian natural gas that powers many of their power plants, but they — and much of the rest of the world — have also been dependent on Russia for raw and enriched uranium. The biggest catalyst for uranium prices in recent years though has been the launch of the Sprott Physical Uranium ETF with a market cap of around $5 billion. This soaked up the available supply and ended the price war triggered by Kazakhstan, which drove many junior mining companies to ruin. It can be expected that the price for uranium will continue to rise.
The oldest adage in commodity markets though is: “the cure for high prices is high prices”. This is because major trends push traders out of the market and encourage fresh supply into the market. Cocoa is a good example of this. Chocolatiers are now complaining about the price (which is up 166% year-on-year) and adjusting their recipes accordingly. At the same time, farmers in several countries are increasing their acreage. There will be a supply response in due course. It is only a matter of time.
Gold, on the other hand, is an asset with a limited supply. It is both expensive and difficult to significantly increase the mined supply. Gold is also one of the longest-lived assets in the world. New supplies are most likely to be available from those who already own it. For prices to fall on a large scale, owners must have an incentive to sell. And the current environment of geopolitical tensions and financial uncertainty is certainly not conducive to a selling mood. The Gold/Silver ratio keeps at a historically somewhat elevated 85.27, however in February this ratio was above 90.
Once hyped Lithium is down another 10.78% in August reaching a loss of 63.21% year-on-year. This is what happens when everyone expects an upward move pushed by battery usage in EVs. When everyone is on one side of a trade, the opposite tends to happen. Also you might reconsider having some nice organic breakfast eggs as their price rose by 58% in August nearly tripling in price year-on-year.
The Rest …
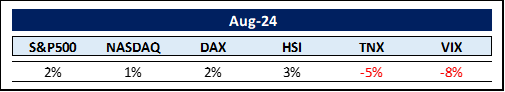
After what felt like an eternity, the inverted yield curve has finally straightened out again and now exhibits “normal” characteristics. This change, known as “uninversion“, is due to the fact that the market now expects more aggressive rate cuts, which has caused short-term interest rates to fall. However, it is important to note that the end of an inverted yield curve does not necessarily mean that the economic problems are over. Historically, recessions often follow the resolution of an inverted yield curve. Even if the yield curve is no longer inverted, it is still a good time to be cautious and plan accordingly.
Also, the Sahm Rule was recently triggered: The Sahm Rule, an indicator that has shown every recession in the US since 1949, turned red in July in light of a weaker labor market report. Developed by economist Claudia Sahm just in 2019, the rule states that the US is already in a recession if the three-month average unemployment rate rises by 0.5 percentage points from the 12-month low. However, due to the unique labor market dynamics seen today, this signal could be overstated. It’s also worth noting that the actual unemployment rate doesn’t usually matter. Instead, the change from the 12-month low has the biggest impact on recession dynamics. In addition, the rate of change can cause economic dynamics to change rapidly. More unemployed workers can weaken consumer demand, which in turn leads to an increase in unemployment. Although the unemployment rate is near historic lows, it has risen slightly due to the nature of the current U.S. labor force. In 2024, the increase in unemployment is due to a growing labor pool caused in part by workers immigrating to America who have not yet found work. Half of this percentage point increase is due to an influx of unemployed workers into the labor market triggering the Sahm Rule. In contrast, in previous recessions, rising unemployment was fueled by layoffs. It therefore appears that the Sahm Rule has lost its predictive nature this time and should not be overestimated.
Also worth drawing attention to is Tobin’s Q. The Nobel Prize winner James Tobin developed a simple but precise stock market indicator: Tobin’s Q. Tobin’s Q, often simply referred to as the Q ratio, is a measure that can be used to assess whether a market or a company is overvalued or undervalued. It is calculated by dividing the market value of a company by the replacement cost of its assets. A value of Q > 1 indicates an overvaluation, a value below 1 an undervaluation. It currently stands at 1.73 and is therefore in the danger zone. The lowest recorded Tobin’s Q value was around 0.28. This was in the early 1980s, a time characterized by economic recession and high inflation in the United States. The highest recorded Tobin’s Q ratio was around 2.17. This peak was reached during the dot-com bubble in the late 1990s and early 2000s, just before the dot-com crash. The median is 0.72.
For now however, the bull market seems to have legs as of now 57% of all stocks in the S&P500 are above their 50-day moving average indicating positive momentum for a significant portion of the index. The “Magnificent Seven” stocks — Apple, Microsoft, Amazon, Alphabet, Meta, Nvidia and Tesla — currently make up around 31% of the S&P 500. This is down from the 57.85% they accounted for at the beginning of this year (January – May). A broadening market is always a sign of a much healthier environment.
Thus, the bull market on the stock markets seems to be alive and kicking. This can be also seen in the way small investors invest. They are currently buying bonds and money market funds. This year alone, investors have poured a net $20.5 billion into U.S. equity mutual funds and exchange-traded equity funds, while they invested a net $207 billion into bond funds and exchange-traded bonds. This means that ten times more was invested in bonds than in equities. Retail money market investments, which are basically excess cash in brokerage accounts, have also increased 100% over the last two years to a total of $2 trillion (of a total of $6 trillion accumulating interest in short term facilities). We will know we are in a bubble when these metrics reverse. For now, the rally still has plenty of liquidity headroom. “Logically speaking, it doesn’t make a whole lot of sense for $6 trillion-plus to be sitting in money market funds if the yield is going to go down,” says Kathy Jones, chief fixed-income strategist at Charles Schwab & Co. “We had a lot of talk about rate cuts, and they haven’t happened, so maybe there are a lot of people who are just waiting for it to happen.” Well, everyone is expecting a 25-50 bps rate cut in September, which could trigger another rally on the stock markets. And small caps in particular could benefit from this increased liquidity.
Alphabet has proposed to acquire privately held cybersecurity company Wiz for $23 billion. This represents a multiple of 46 times expected annual sales. Such an extremely high valuation normally only occurs in roaring bull markets. Well, small-cap companies in particular have not moved much in recent years. Therefore, 46 times prospective earnings can be seen as a harbinger of things to come, as private markets tend to lead public markets. Coupled with the Federal Reserve‘s more dovish tones, we could see a bounce in small-cap tech stocks in the near future.
And now for something completely different: China and Taiwan. As China becomes increasingly aggressive in the South China Sea and continues to expand its military maneuvers around Taiwan, international commentators are becoming increasingly nervous about a possible military invasion of Taiwan. Such an invasion would have an immediate impact on the entire Western world. And why? Taiwan produces over 60% of the world’s semiconductors and over 90% of the world’s most advanced semiconductors. Most of these are produced by a single company, Taiwan Semiconductor Manufacturing Corporation (TSMC). If China were to seize TSMC in a hostile act, the Western high-tech industry would come to a temporary standstill.
As reported by the Financial Times, Chinese President Xi Jinping personally told European Commission President Ursula von der Leyen in April last year that the US was trying to tempt China to invade Taiwan, but that he would not fall for the bait. He warned that such a conflict with the United States would destroy many of China’s achievements and undermine its goal of achieving the country’s “great rejuvenation” by 2049. The report is supported by Cui Tiankai, the former Chinese ambassador to the US, who said a few months ago: “They [the US] will provide military support, they will provide weapons for proxy wars, and the Chinese will kill Chinese. We will not fall into this trap.” In addition to a direct invasion attempt, there is the soft solution of gradually assimilating Taiwan along the lines of Hong Kong. Taiwan’s dominance in the semiconductor sector is the clearest reason why everyone has an interest in the island. To prepare for the inevitable, the world’s largest semiconductor foundry, TSMC, is building new plants in Arizona, Kumamoto, Japan and Dresden, Germany. Once these plants are up and running, assimilation will already be in full swing. However, China’s interest in Taiwan is not only economic, but also emotional, and precedes the development of the semiconductor sector. It goes to the heart of the Communist Party’s claim to represent all Chinese everywhere. Let us hope for a peaceful solution. Here is the Greek Stoic philosopher, Epictetus: “It is not things that trouble us, but our judgment about things.”
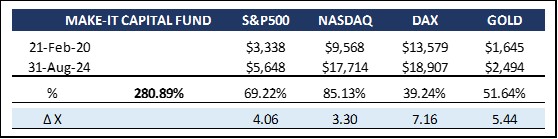
- * As a unique hedge fund for a comprehensive blockchain / cryptocurrency portfolio, the Fund allows investors to participate in the full spectrum of distributed ledger / crypto assets with just one investment.
- * The Fund aims to reduce inherent risk and volatility without compromising performance by applying its proprietary 5-pillar strategy.
- * The Fund is operated by Make-It Singapore and managed by Make-It New Zealand.
- * The Fund is fully transparent and always trades at the exact NAV.
As alluded to above, the abrupt end of the yen carry trade had a detrimental impact on all risk-on assets, especially cryptocurrencies. The entire crypto market lost around 9% or $220 billion in August. Unfortunately, the Fund was unable to turn the tide completely. Our second largest position after Bitcoin is Ethereum (ETH), and ETH lost an astonishing 22% last month. Did we sell in panic? No. And if only half of the VanEck predictions above materialize, we’d see another five-fold increase in ETH alone. ETH could be compared to the TCP/IP of the coming financial (r)evolution and also the entire web3 gambling industry. Or as VanEck formulated it: ETH is the internet reserve currency. We clearly have long-term confidence in ETH. “The big money is not in the buying and selling, but in the waiting.” – Charlie Munger.
Jeremy Allaire (founder of Circle – USDC): “My perspective here draws on closely watching internet technology adoption life cycles over the past 35 years. We’ve seen an unrelenting march of open networks, open protocols and open software, with layer upon layer of infrastructure on the internet that deepens its utility for society and the economy.” Now blockchain technology infuses the internet with irrevocable, 100% transparent transactions. Here is Allaire again: “Crypto represented the next logical layer of infrastructure for the internet.” The future is now.
Thank you for your time and attention
Sincerely,
Philipp L.P. von Gottberg